
The interpretation of statistics includes trend.
Trend means the tendency of statistics to average out up, level or down over several weeks or even months as long as the situation remains.
The closer one is to the scene of the stat, the more rapidly it can be adjusted and the smaller the amount of time per stat needed to interpret it.
One can interpret one’s own personal statistic hour to hour.
The head of a division or portion of an organization can interpret on a basis of day to day.
The heads of a larger portion of an organization needs a few days’ worth of stat.
An
A more remote governing body would use a trend (which would be several weeks) of divisional stats to interpret.
In short, the closer one is to a statistic, the easier it is to interpret it and the easier it is to change it.
One knows he had no stat on Monday—he didn’t come to work. So Tuesday he tries to make up for it.
At the other end of the scale, a more remote managing body would have to use a trend of weeks to see what was going on.
Reading Stat Trends
A trend is an inclination toward a general course or direction.
Trends can be anything from Danger to Power, depending on the slant and its steepness. It is also possible to have a Non-Existence trend.
Plotted by weeks: | |
A Non-Existence trend would look like this.
|

This would also be a Non-Existence trend.
|

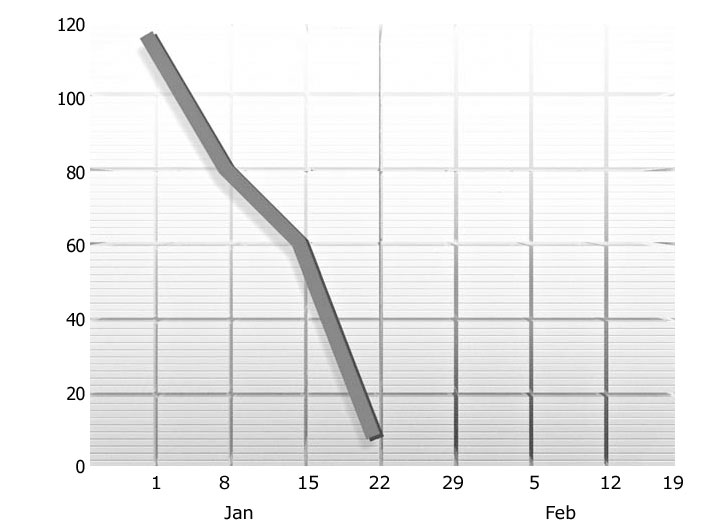
This would be a Danger trend.
|

This would be an Emergency trend.
|
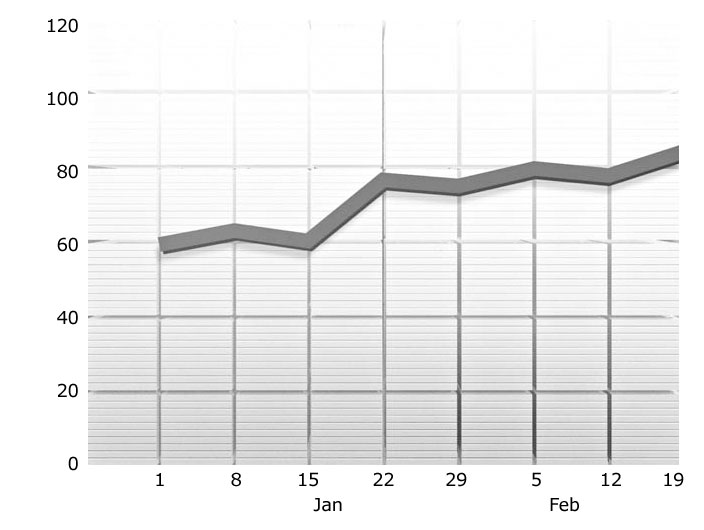
This would be a Normal trend.
Any slight rise above level is Normal. |
This would be an Affluence trend.
|
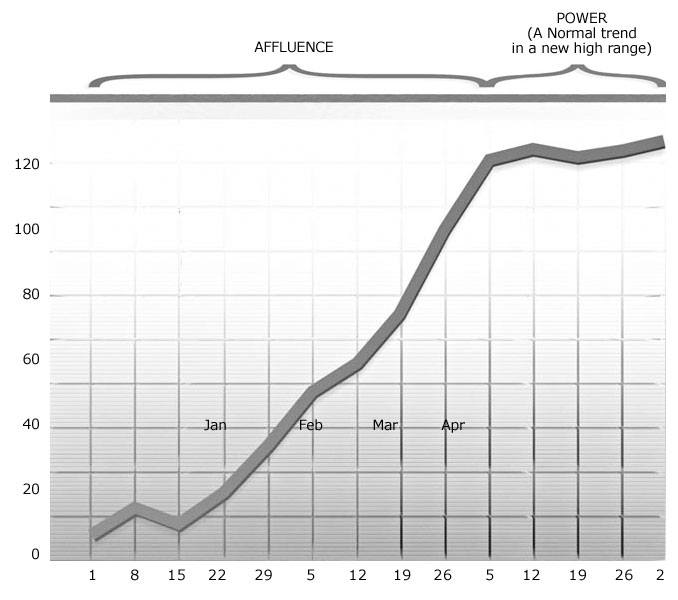
This graph shows an Affluence going
into Power. | |
the head of a Church of Scientology organization, responsible for the planning and running of the organization as well as its statistics and viability.